Case study · Energy intelligence

From monitoring to control.

A live home-energy dashboard became a locally controlled, safety-engineered system. Now 182 days of real winter use are shaping what it should do next.

We run our home on the evidence
182
winter days at half-hour resolution
5.02
kWh average daily winter import
20%
of import lands in the 4–7pm peak
25 pts
live, floor-limited discharge
2/2
charge + discharge paths proven

The problem

Visibility was useful. It was not enough.

The first version did exactly what a good reporting system should: it brought solar generation, battery state, household demand, half-hourly energy prices and financial projections into one live view.

It alerted when prices turned negative. It tracked import, export and the year-end position. It made the energy system legible.

But the action still sat elsewhere. The cloud API used for control was known to be unreliable. A successful command could be followed by failed reads, leaving the system unable to confirm state or safely revert. And tomorrow’s schedule still depended on assumptions about when the house used energy.

The next step was not “more AI”. It was a trustworthy loop: read locally, act locally, verify the result, fail safe—and use real history to decide what should happen next.
The journey

Report. Control. Plan forward.

01

Make energy visible

Unify live solar, battery, grid, Agile pricing and financial performance. Alert on the moments that matter, including negative prices.

02

Move control home

Replace the flaky cloud control path with local Modbus reads and writes. Set charge and discharge windows, power levels and safe floors at the inverter.

03

Let history shape strategy

Pull 182 days of half-hourly winter consumption. Find when demand really lands, then design the winter policy around evidence rather than tariff folklore.

The screenshots

The interface is the evidence.

These are not concept renders. They are captures of the working system: its build ledger, its usage analysis and the live dashboard the household uses.

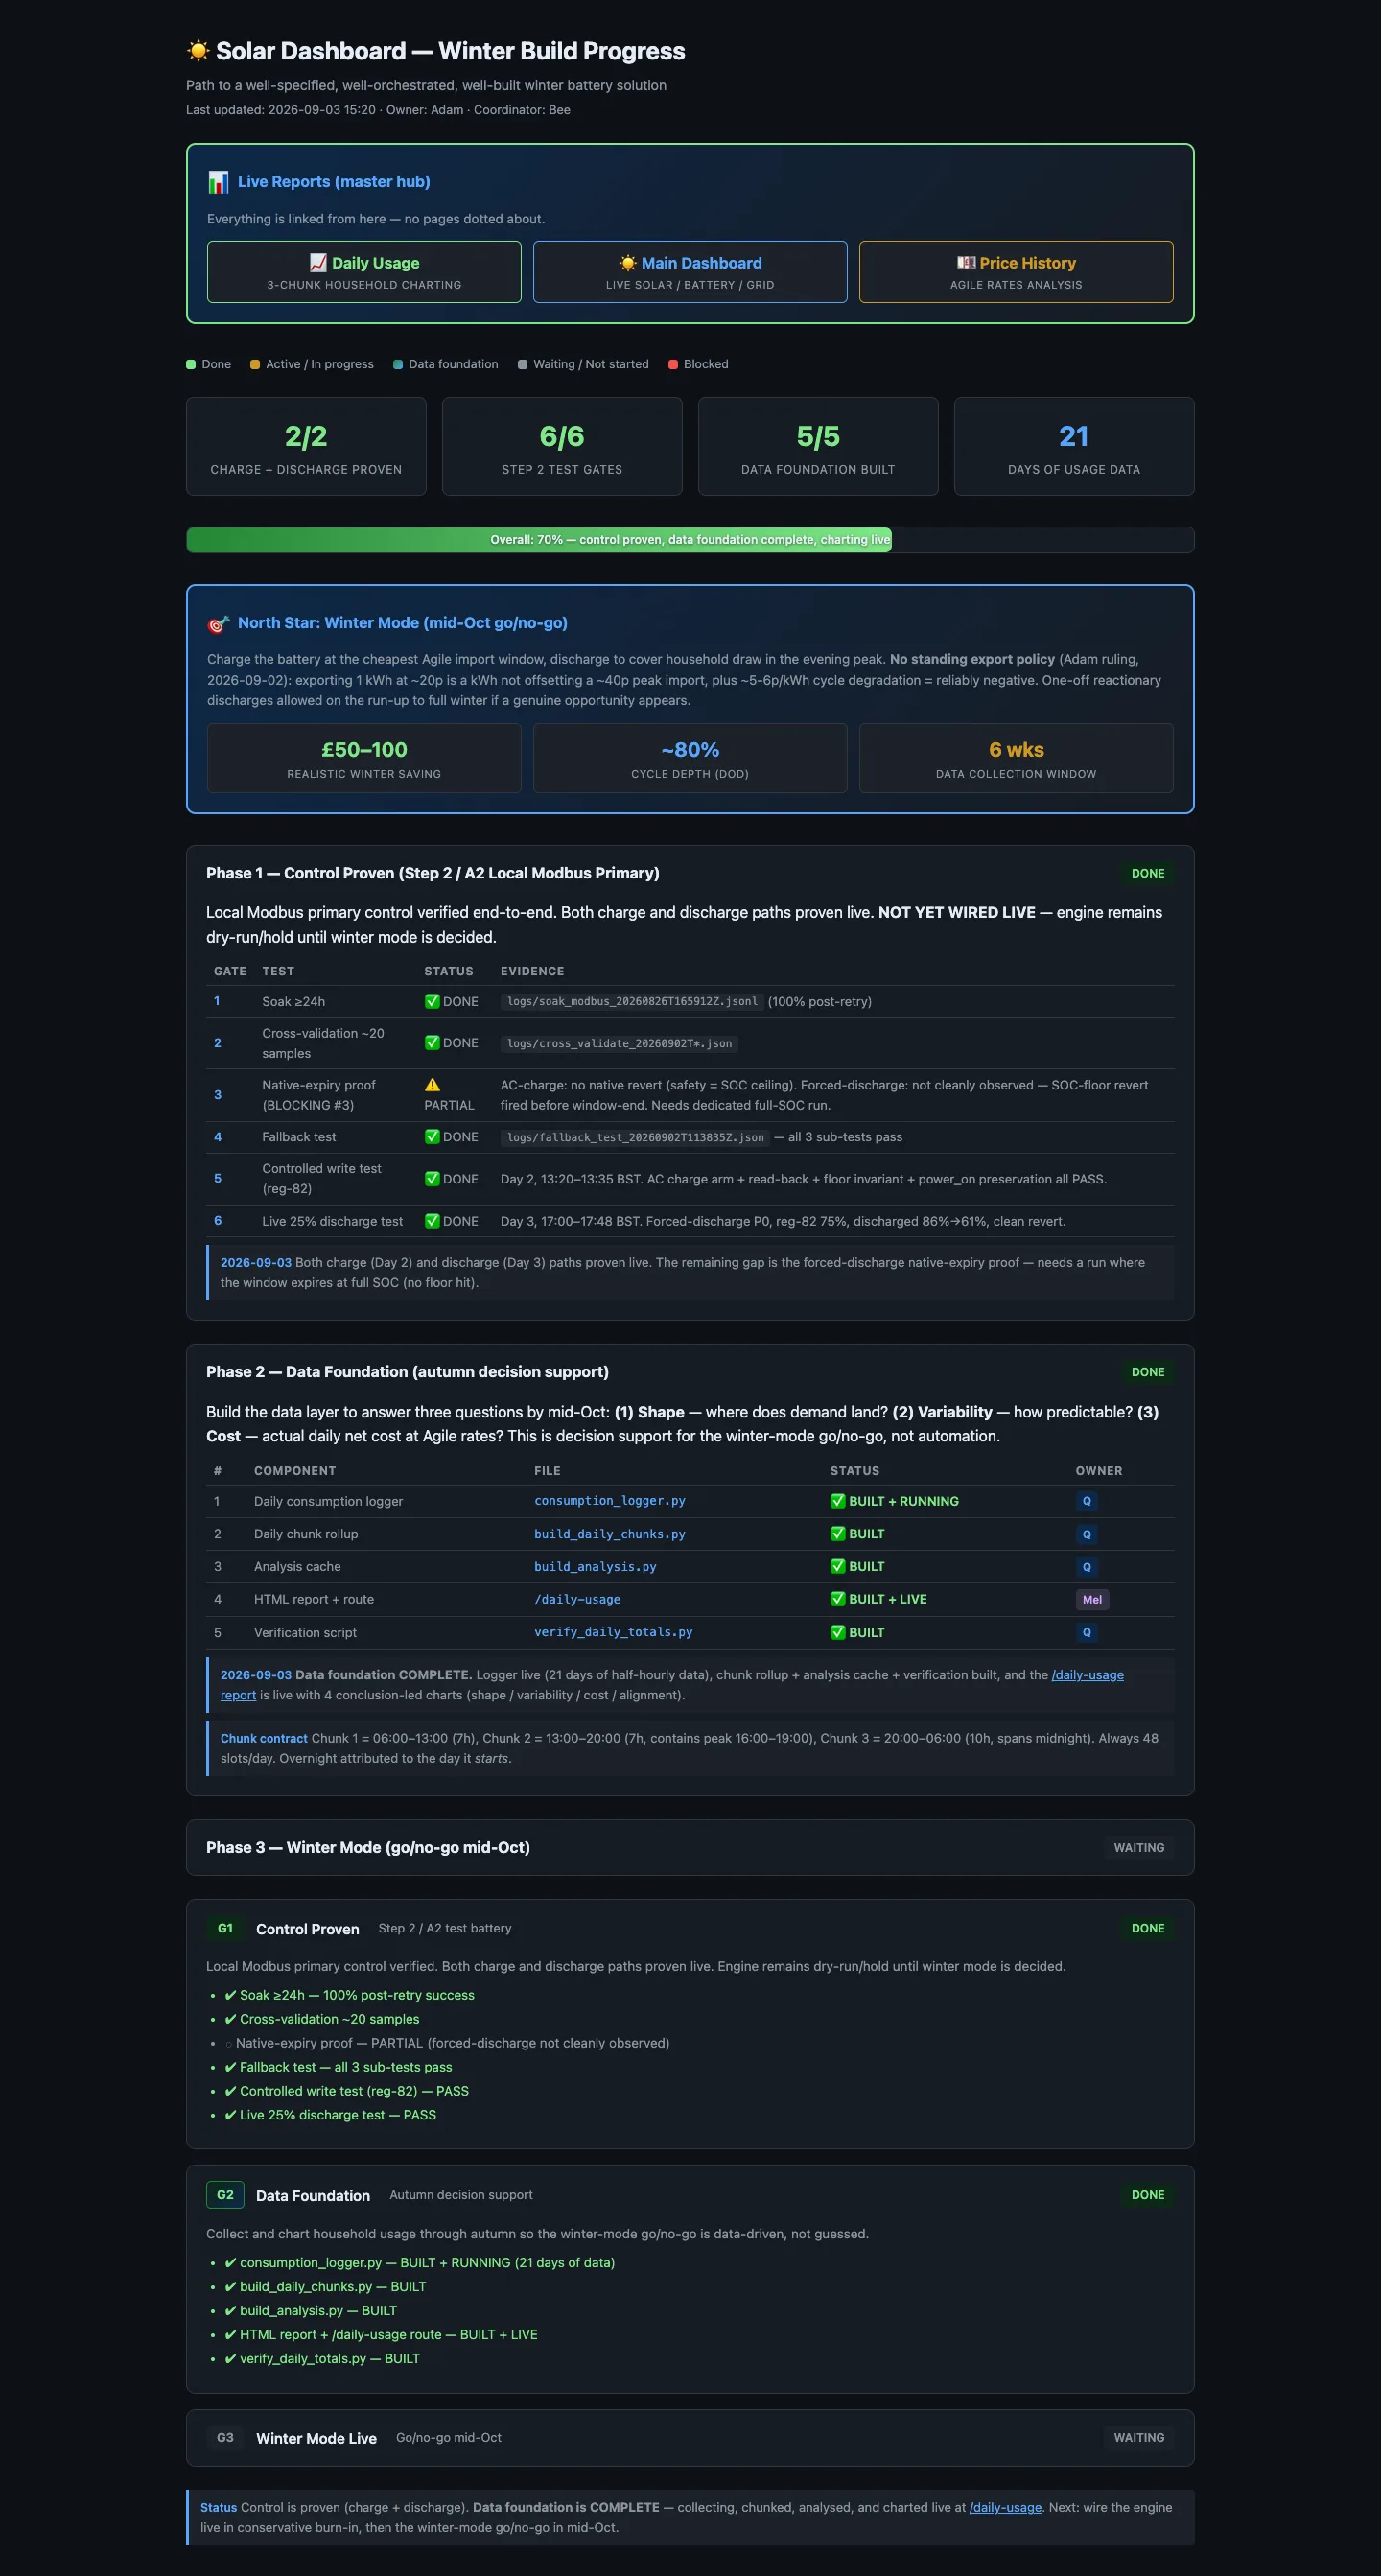
Solar Dashboard winter build-progress hub showing control test gates, data foundation and winter-mode plan
01 · One place to see what is proven—and what is not.The master hub tracks the live reports, control gates, evidence files and winter-mode go/no-go. It visibly records the remaining native-expiry gap instead of hiding it.
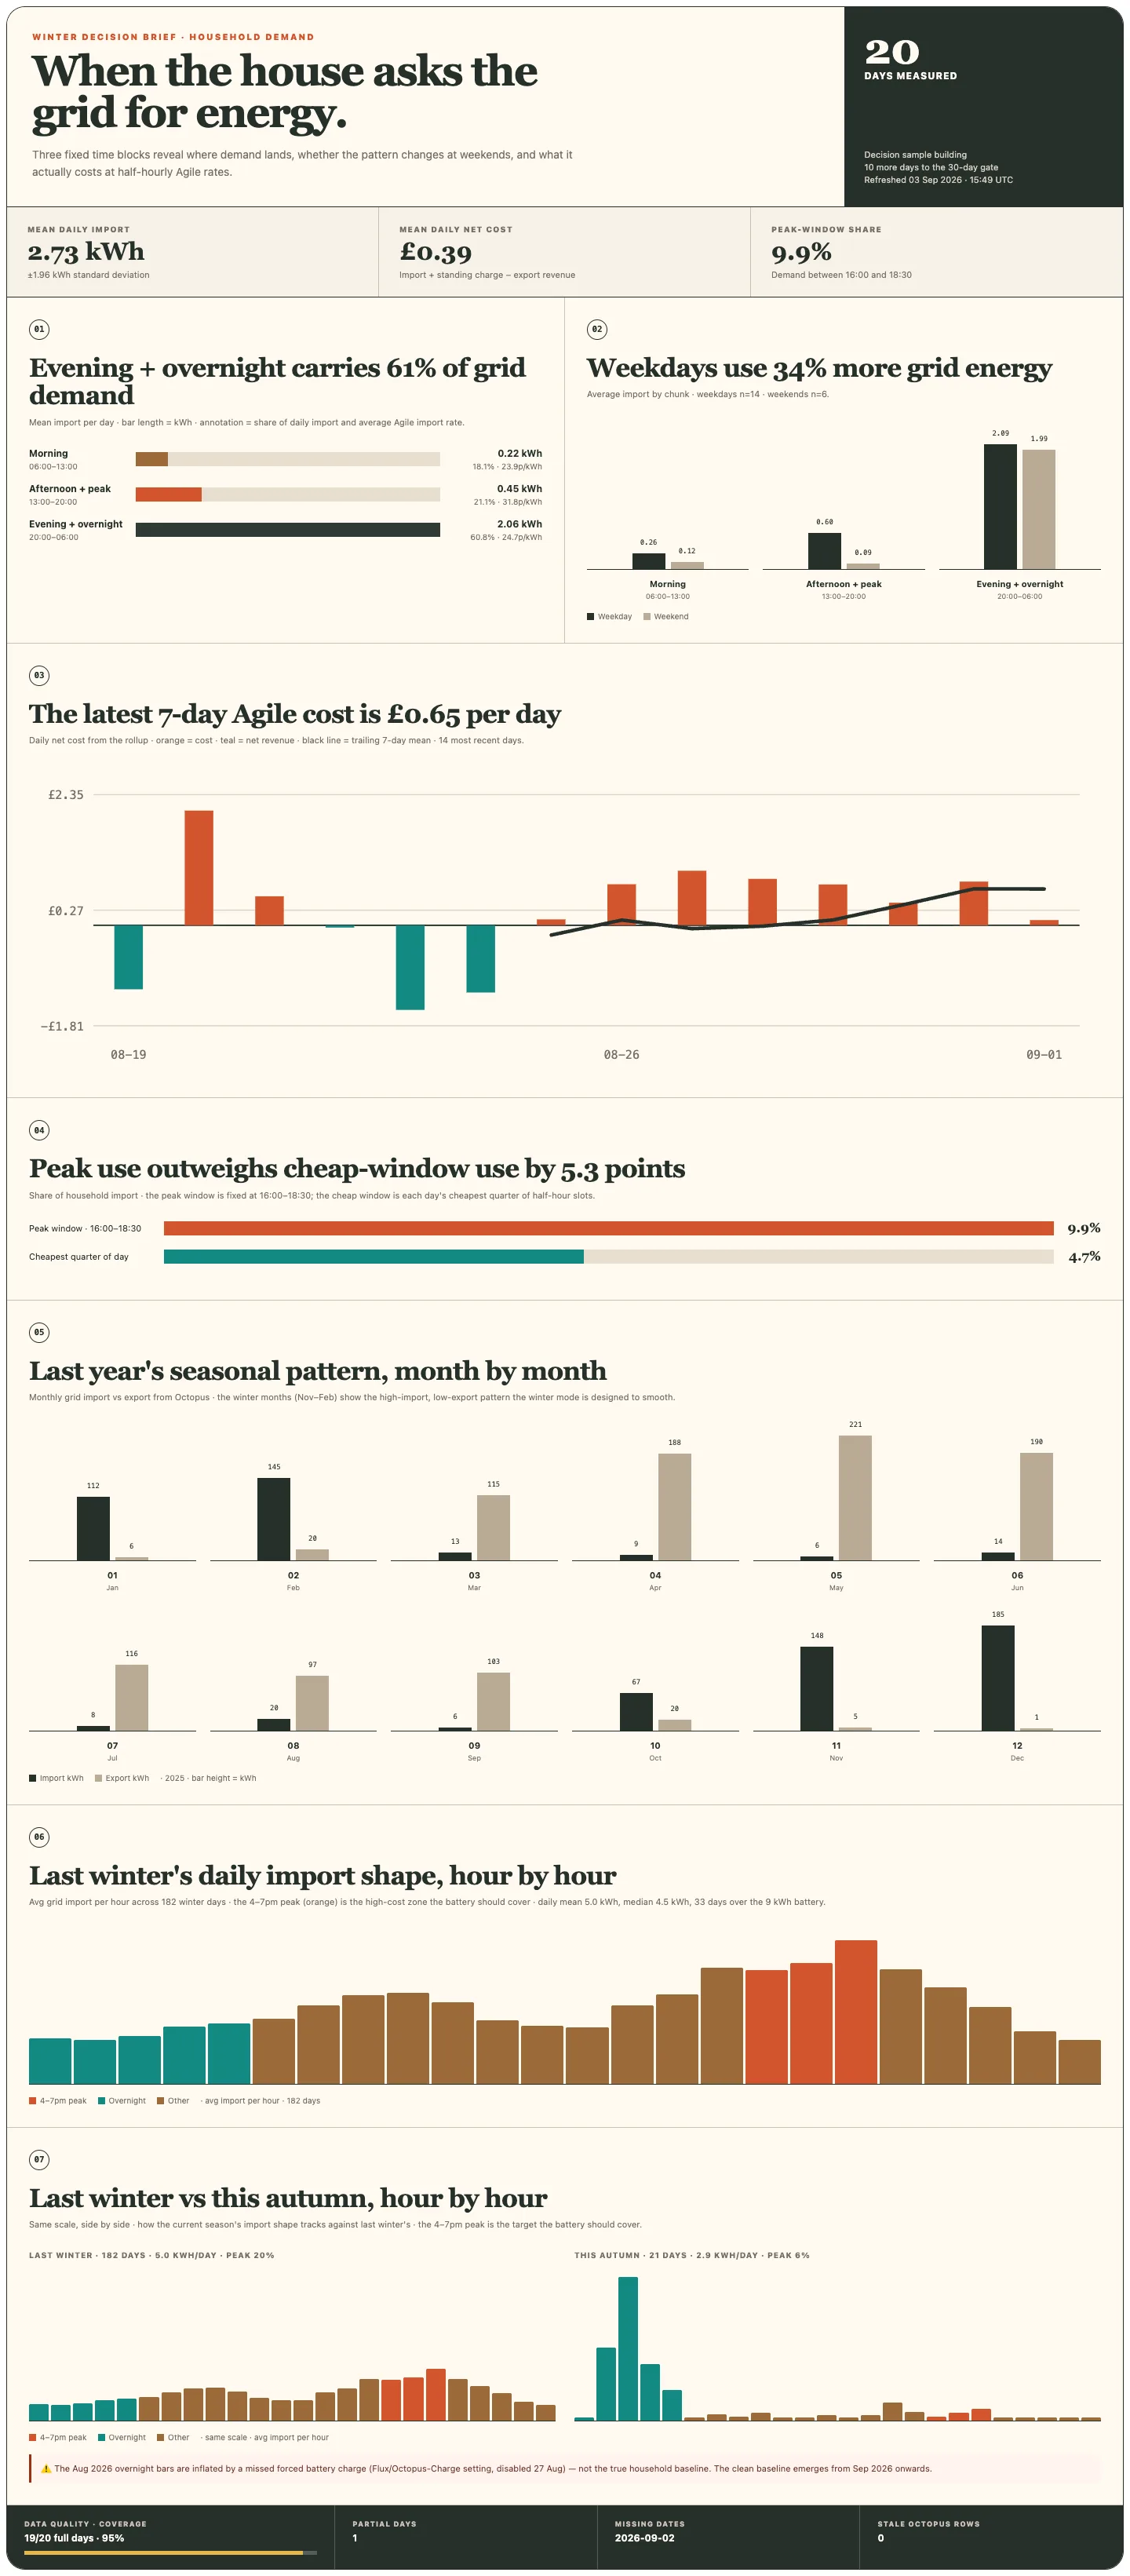
Daily usage report showing household demand shape, Agile cost, seasonal pattern and winter comparison
02 · The house has a shape—and winter changes it.The report separates shape, variability and cost. Its winter view shows the 4–7pm peak clearly, while its data-quality note flags an autumn forced-charge artefact so it cannot be mistaken for normal household demand.
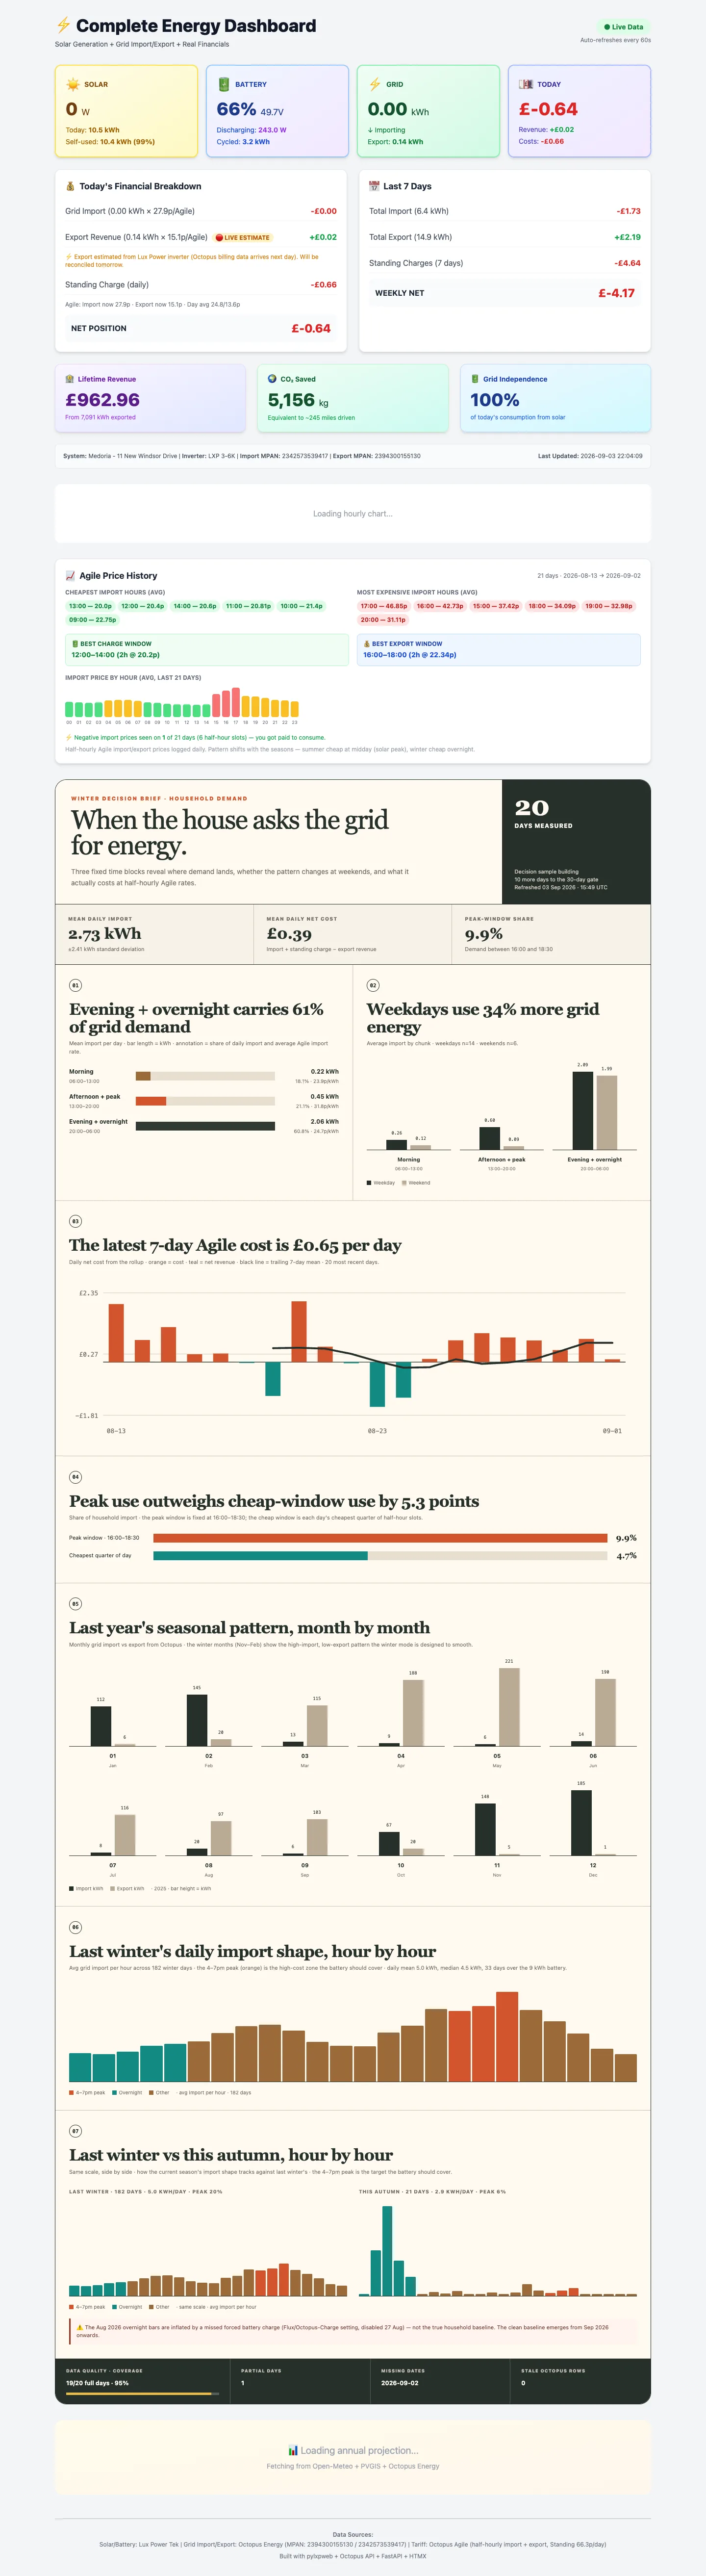
Live Complete Energy Dashboard with solar, battery, grid, Agile rates, financials and usage report
03 · Live operations, not a presentation layer.The main dashboard joins current solar, battery and grid state with Agile rates, daily and weekly cost, annual performance and the decision report below it.

The safety story

Control only counts when failure is boring.

Local access removed the cloud dependency from the control loop. It did not remove risk. The write path was treated like production infrastructure: explicit authorisation, independent floors, state read-back, bounded windows and a safe default.

25%

Hardware floor

The inverter’s native discharge cutoff is fixed at 25%. A separate dynamic floor limited the live test to exactly 25 percentage points—from 86% to 61%.

HOLD

SAFE-HOLD

If the local reading is stale or the inverter is unreachable, the engine refuses to act. The fallback test proved safe hold, labelled dashboard fallback and clean recovery.

R/W

Write, read back, revert

Commands are verified against inverter state. Charge and forced-discharge paths both passed live tests, including the 75% discharge power command and a clean revert.

1 gap

Native expiry

The mechanism and watcher exist, but forced-discharge expiry is not yet cleanly proven: the safety floor correctly reverted the test before the window could expire.

Proof ledger: five of six Step 2 gates are clean. The sixth is partial, not failed. Both control paths are live-proven; the remaining test is a dedicated forced-discharge run that reaches its native window end without first hitting the SOC floor.

The data story

Last winter changed the plan.

5.02 kWh per winter dayThe average fits inside roughly 9 kWh of usable battery capacity.
Only 13.5% arrived overnightMost demand was not where an overnight-only strategy assumes it will be.
20% landed in the 4–7pm peakThat is the expensive period the battery should cover first.
18% of days exceeded 9 kWhA single overnight fill will not cover every high-demand day.

The reusable pattern

Every proof point is a pattern we can adapt.

This is an energy system, but the operating pattern is broader: observe reality, move the critical loop closer, constrain every action, verify state, and let history improve the next decision.

OperationsSense equipment locally, issue bounded commands and verify the physical result.
PricingMatch flexible demand to variable cost without relying on a fixed schedule.
CapacityUse historical peaks and distributions to plan stock, staffing or compute.
RiskEncode hard invariants and safe states before automation gains authority.

Proof over promise

Bring us the decision your business keeps making by hand.

We will start with the evidence, define the safe operating boundary, and build the smallest working loop that can prove its value.

Build a proof with us